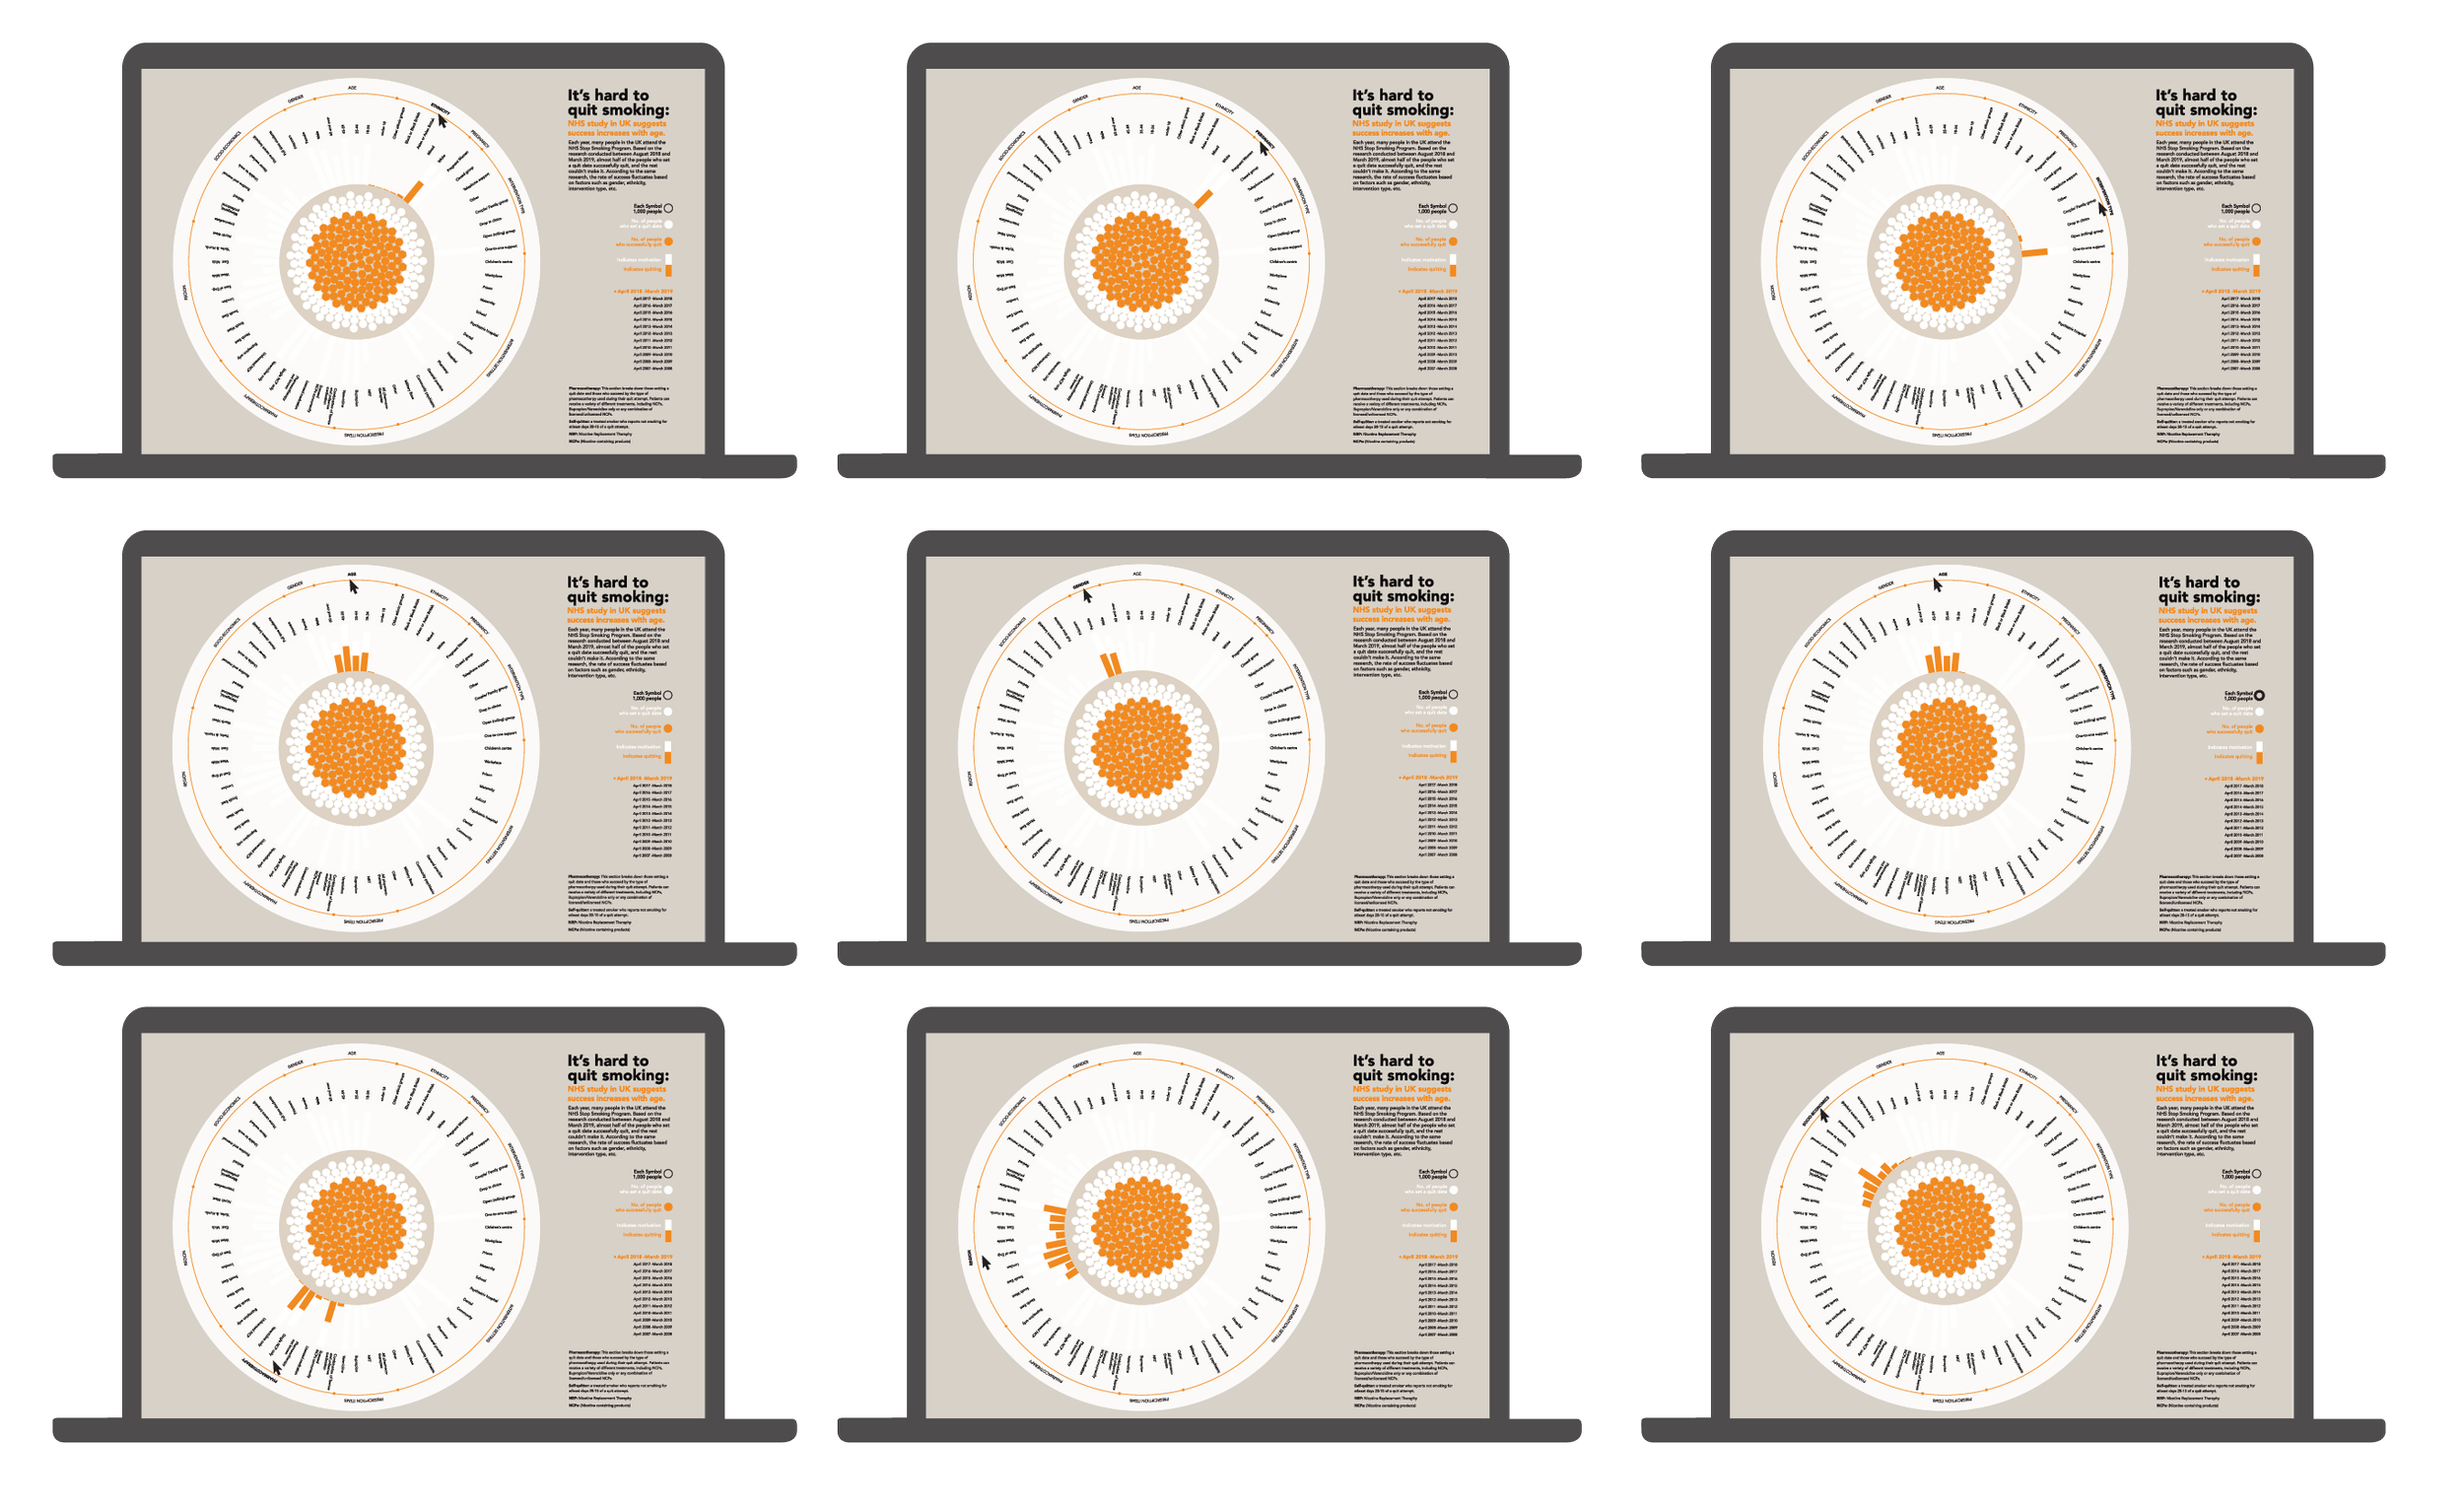
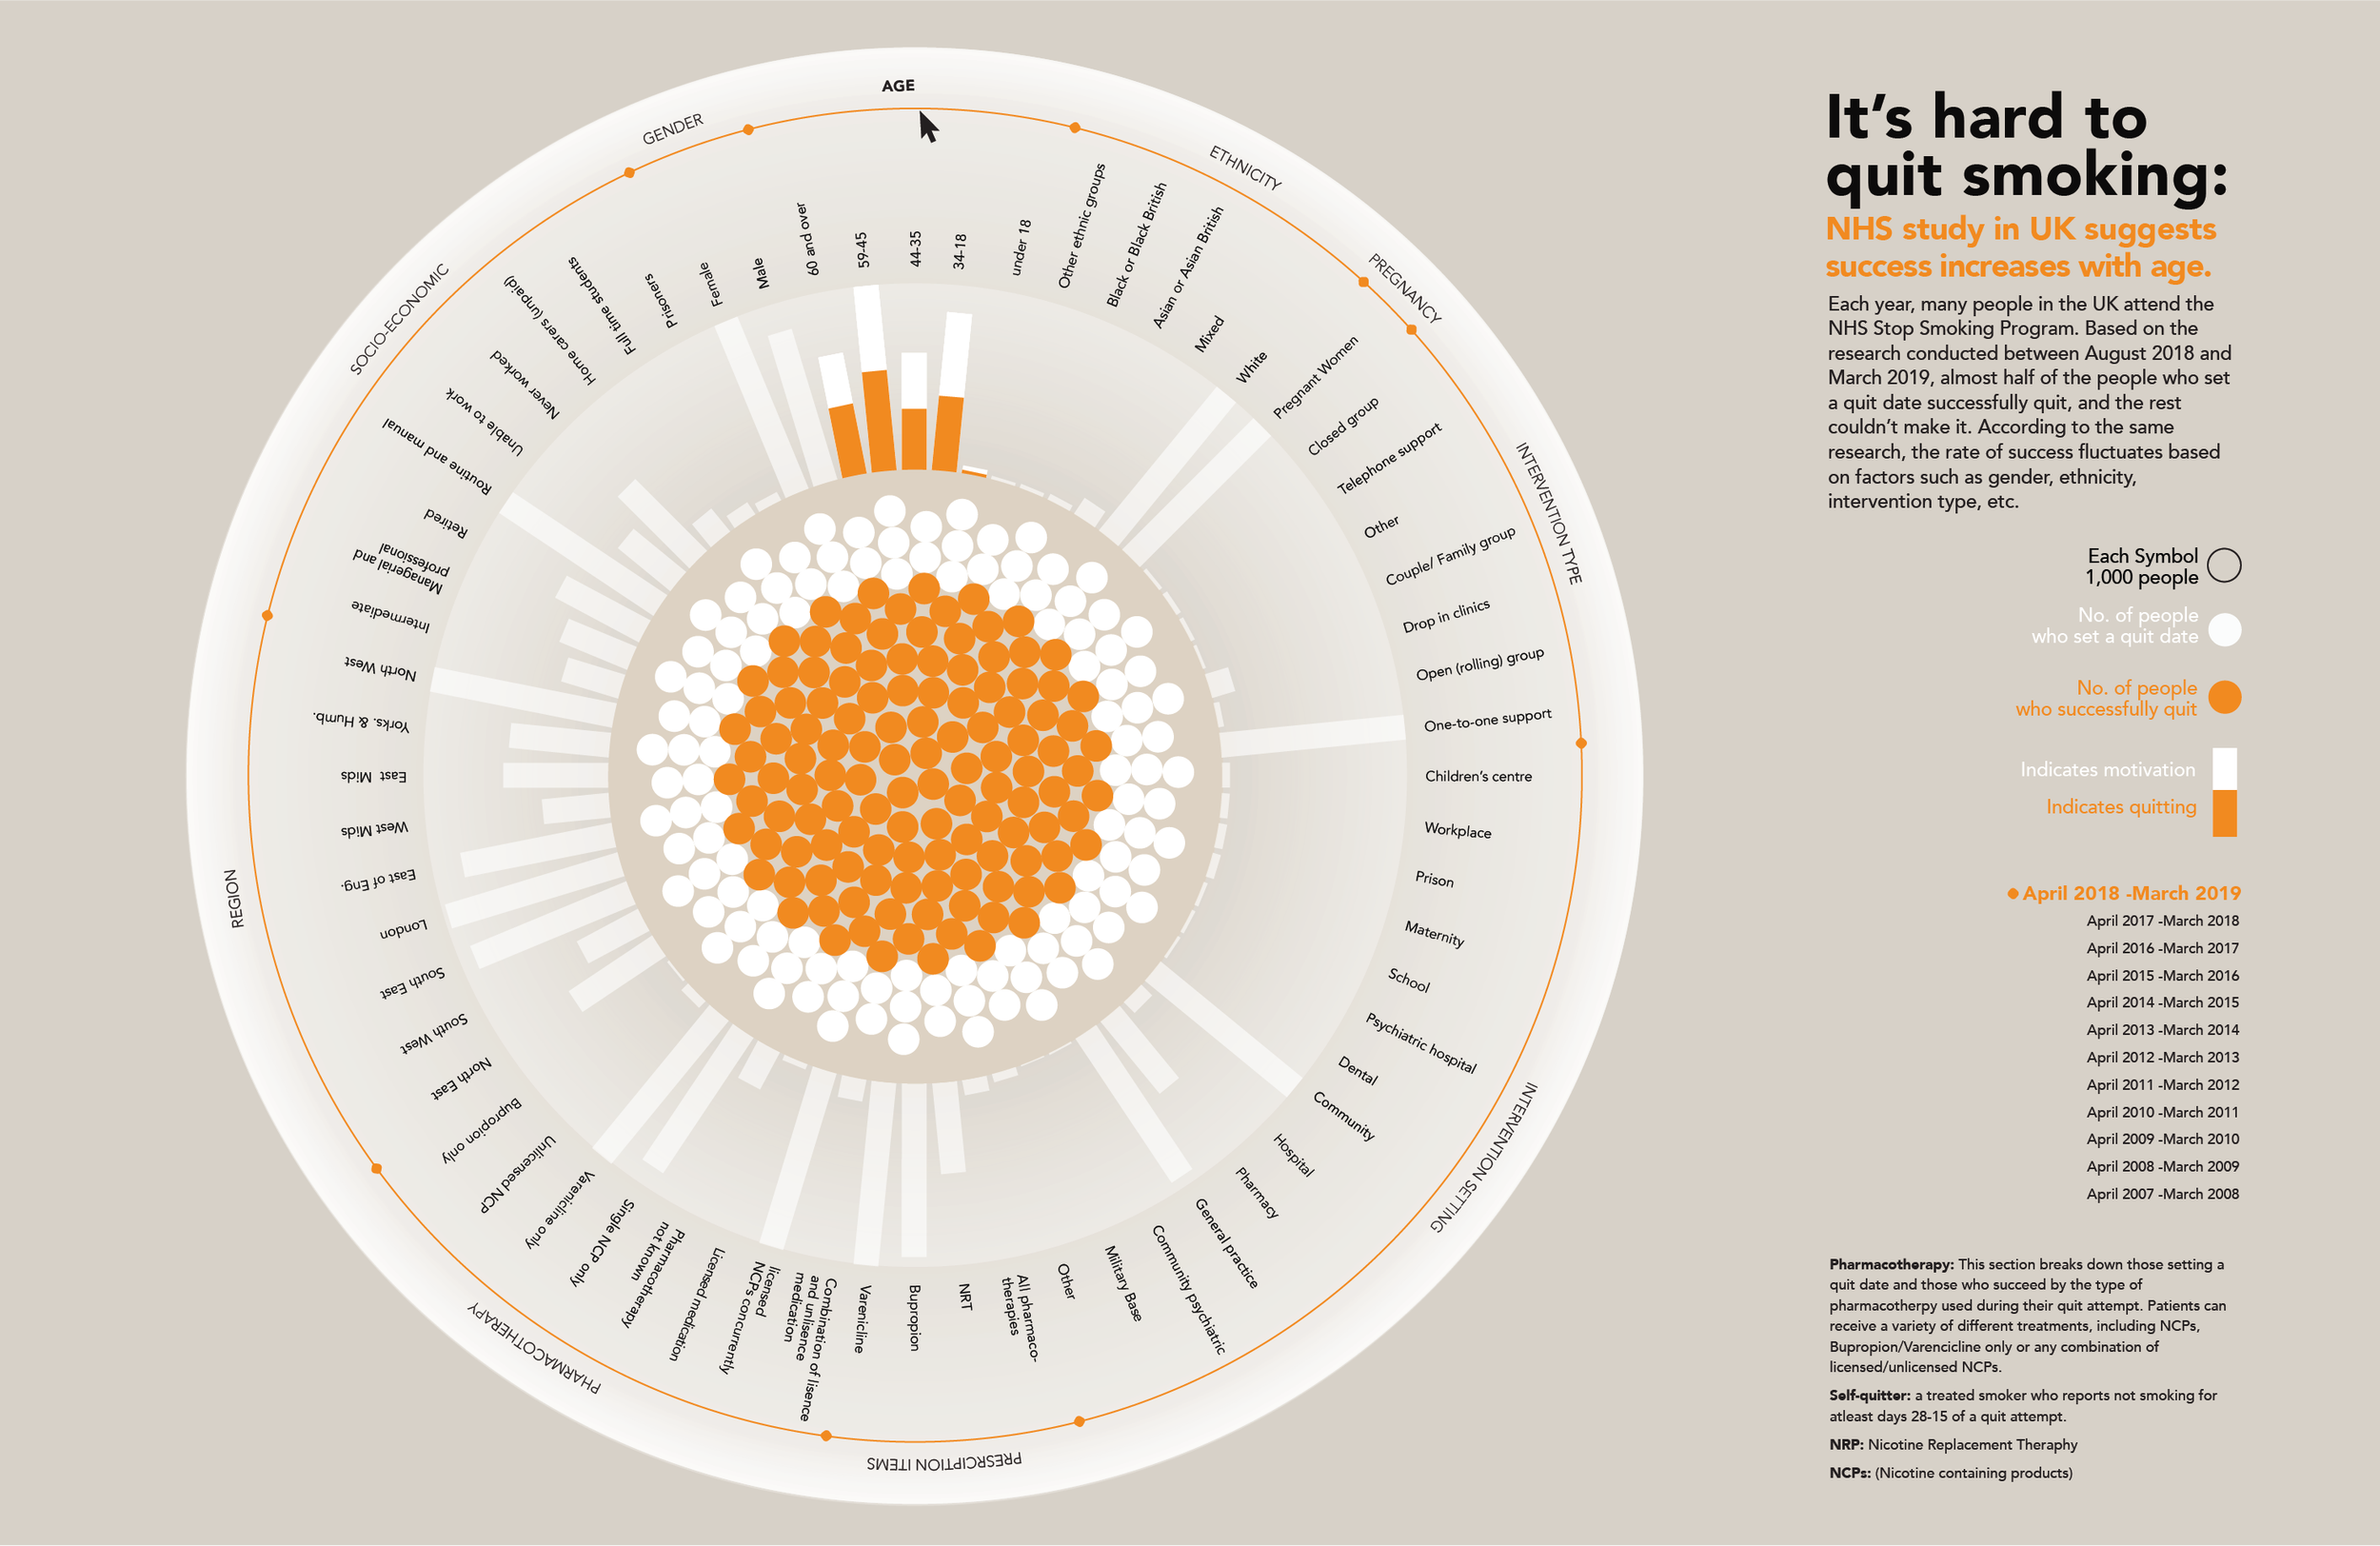
This project focused on transforming complex public health data from the NHS Stop Smoking Services report into an engaging and accessible interactive infographic. The visualization highlights smoking cessation trends in England from April 2018 to March 2019, exploring the relationship between individuals who set a quit date and those who successfully quit while examining key factors such as age, gender, ethnicity, recommended pharmacotherapies, and behavioural support. Through thoughtful data visualization and interactive storytelling, the project makes large-scale health statistics easier to understand, helping users identify patterns, compare outcomes, and gain insight into the impact of smoking cessation services in reducing health inequalities and improving population health.
NHS Stop Smoking Services Interactive Infographic
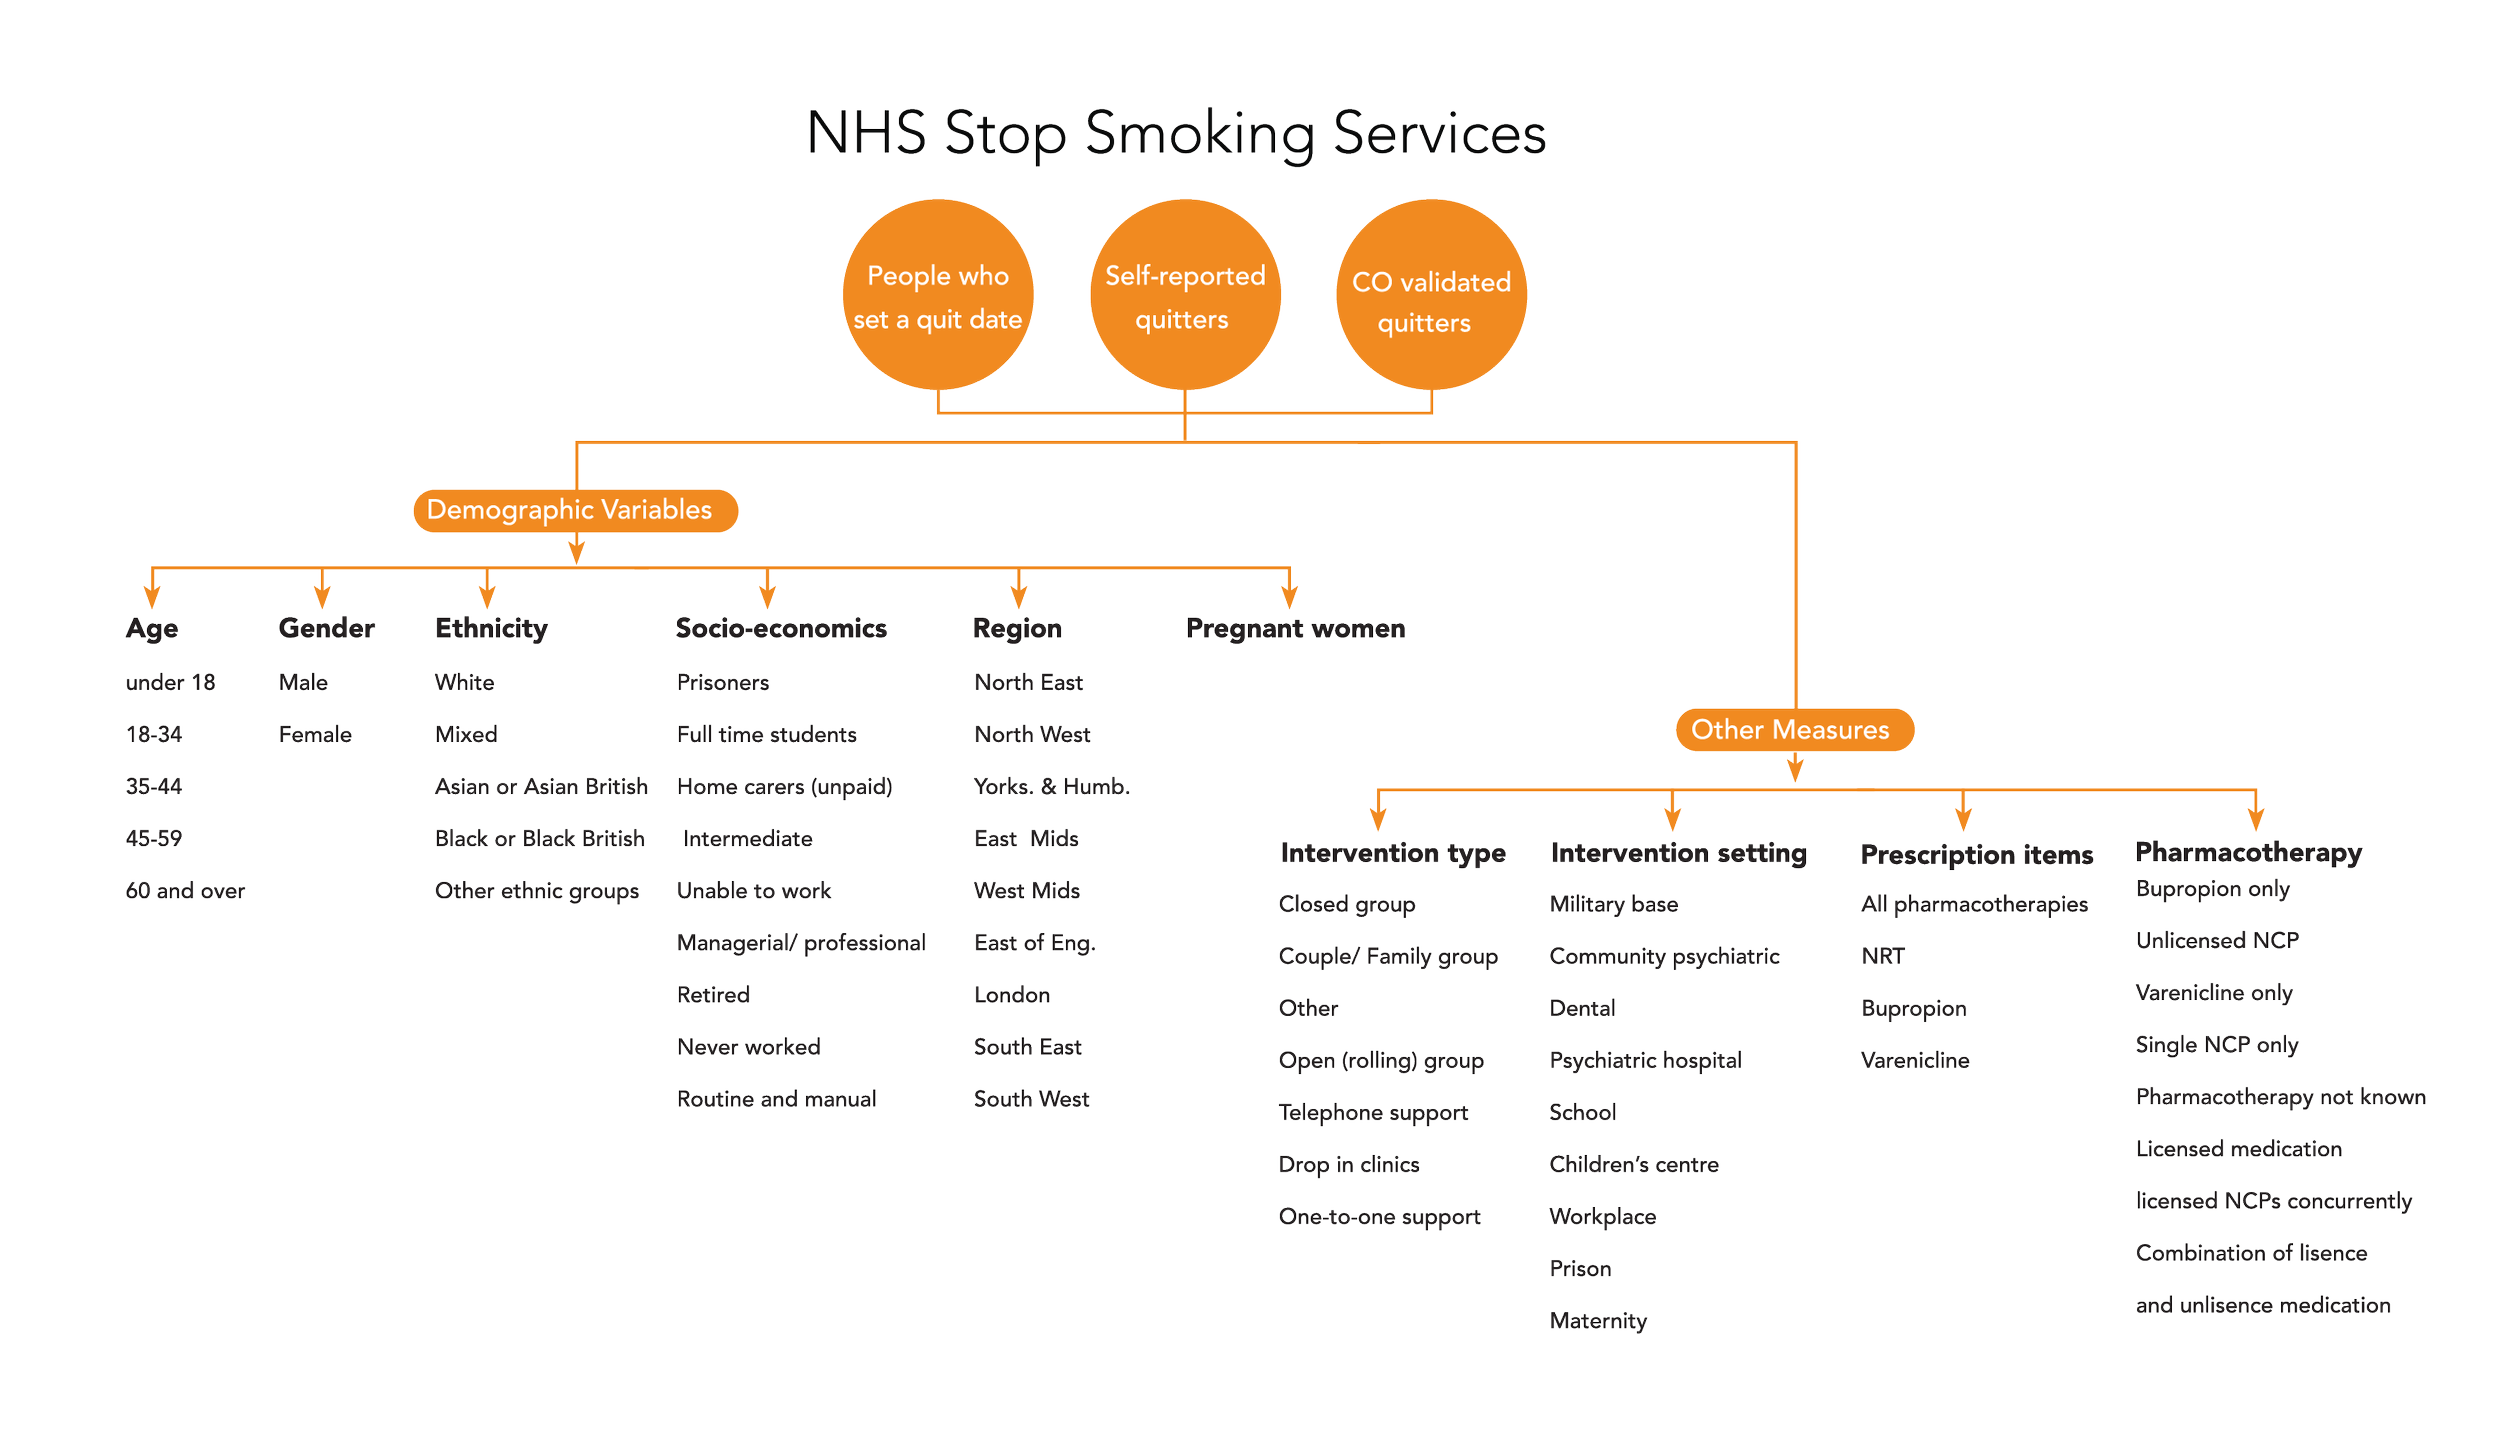
Factors
Different Screens of the Interactive Infographic
(when the user hovers their mouse over the specific area, other factors fade and the chosen factors get highlighted)